December 5, 2017
Visualizing Grant Diversity
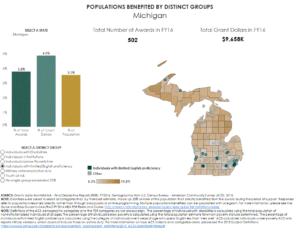
Visualizing Grant Diversity: The Demographics of State Arts Agency Grants is NASAA’s new custom resource showcasing your grants data together with underlying demographics of your state’s population. Using new fields from Final Descriptive Reports, these visualizations can help inform your outreach to underserved communities, articulate how your dollars are serving vulnerable populations, and assist your performance measurement and benchmarking practices. You can use the dashboards to answer questions such as:
- Are my agency’s grants distributed equitably based on measurements of income and poverty in my state?
- How do grant and activity locations match up with populations by race?
- How do my grants serve military/veteran populations and populations with disabilities?

If you haven’t already, please see NASAA’s recent webinar for an overview of the project. And if you have not scheduled time to go over your state’s dashboard, please get in touch! NASAA’s research team will review your state’s visualizations and provide guidance on how to interpret the data. Set up a 45-minute consultation today by e-mailing NASAA Grants Data Associate Kelly Liu at kelly.liu@nasaa-arts.org.
In this Issue
From the President and CEO
State to State
- Georgia: Arts Education Campaign
- Tennessee: Creative Aging Tennessee
- Idaho: Arts Powered Schools Summer Institute
Legislative Update
Announcements and Resources
More Notes from NASAA
Research on Demand
SubscribeSubscribe
×
To receive information regarding updates to our newslettter. Please fill out the form below.

