

August 8, 2017
Advocacy Tools Harnessing Grant-Making Statistics
Grant-making statistics can speak volumes in articulating the value of state arts agencies and public funding of the arts. With data from Final Descriptive Reports, in particular, NASAA’s research team can create customized arts advocacy tools to help you demonstrate the benefits of arts funding in your state. Such tools include:
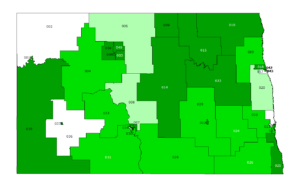 Visualizing grant making: NASAA can map where your agency has awarded grants by federal congressional district, state legislative district or county. Mapping the number of grants and grant dollars awarded shows the reach of your agency and the value of state investment in the arts.
- Showcasing your constituents: NASAA can create lists of grantees—by congressional district, state legislative district or county—documenting for legislators and other policymakers the many communities and constituents that benefit from their support of the arts.
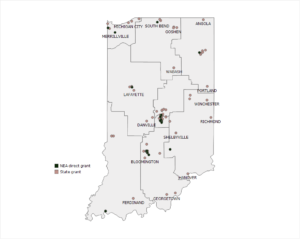 Promoting the federal-state partnership: NASAA creates state-specific NEA Arts Investment Fact Sheets. Each one contains an overview of NEA appropriation trends and dollars leveraged, talking points on citizen benefits of public funding for the arts, data on the local impact of state and federal funding for the arts and a map showing NEA direct grants, state arts agency grants and, when available, state arts agency grant activity locations by congressional district.
Interested? Contact NASAA Research Director Ryan Stubbs or Grants Data Associate Kelly Liu.