

AUTHOR:
Henry Clapp
May 2, 2016
New SAA Funding Visualization
One of the most common information requests NASAA’s research department receives is for historical and comparative state arts agency funding data. These data are extremely useful for strategic planning, budget requests, legislative testimony and advocacy. We are happy to announce a redesign of our Funding Page that puts this legislative appropriations data in your hands.
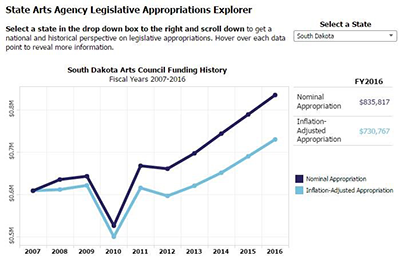
Three visualizations are available using new navigation tabs. Two of them are old favorites: the Per Capita Appropriations Map and the Per Capita Ranking Estimation Tool. Joining those is the brand-new State Arts Agency Legislative Appropriations Explorer. This dashboard contains a wealth of information about the appropriations to each state agency. It provides historical context with a 10-year funding history showing the effects of inflation, as well as national and regional comparisons. Hovering over the data points in each chart provides even more detailed information.
If these visualizations raise new questions about state arts agency funding, or if you are interested in a funding topic not covered on our website, contact Henry Clapp. Happy exploring!