
March 25, 2024
![]() Updated Creative Economy State Profiles are now available, with information that describes the value of arts and cultural production along with job and compensation data in every state in 2022. These data, published by the U.S. Bureau of Economic Analysis (BEA) in partnership with the National Endowment for the Arts (NEA), are a trusted source for measuring the value of the creative economy.
Updated Creative Economy State Profiles are now available, with information that describes the value of arts and cultural production along with job and compensation data in every state in 2022. These data, published by the U.S. Bureau of Economic Analysis (BEA) in partnership with the National Endowment for the Arts (NEA), are a trusted source for measuring the value of the creative economy.
In 2022, arts and cultural production accounted for:
The 2022 data offers further information about the ongoing recovery of the arts sector following the COVID-19 pandemic. The creative economy grew by 4.8% in inflation-adjusted dollars between 2021 and 2022.
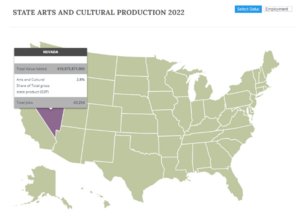 NASAA’s Creative Economy State Profiles help to make data from the BEA’s Arts and Cultural Production Satellite Account (ACPSA) more accessible and engaging. Produced in cooperation with the National Endowment for the Arts, this interactive dashboard provides information in a visual format to describe the creative economy in every state.
The ACPSA data from the NEA and BEA are free and available to use. All national and state data sets, as well as state summary sheets with key data points, can be downloaded from the BEA’s website. Additional summaries, graphics, reports and analyses of current and historical releases can be accessed at the NEA’s Arts Data Profile Series.
Your state’s creative economy story is unique, and this tool allows you to explore and share that story with key decision makers. Use the Creative Economy State Profiles to understand:
NASAA recently released a new research report that examined 2001-2021 ACPSA data, Arts and Creativity Drive Economies and Build Resilience, on the arts and culture sector’s contributions to economic recovery. NEA Director of Research and Analysis Sunil Iyengar explored these findings in the recent blog post, Can the Arts Fortify State Economies in Times of Financial Crisis? Yes, Apparently. NASAA will be hosting a web seminar in April exploring this new research and the latest ACPSA data.
Additionally, this past year, NASAA explored potential updates to the Creative Economy State Profiles with input from state arts agencies and regional arts organizations. As a result of these conversations, the dashboards have been updated for improved accessibility, and NASAA published a new descriptive policy brief. Creative Economy Research: A Primer attempts to address some of challenges in communicating about the creative economy, such as definitional questions and using ACPSA data in conjunction with other research.
Please view and explore the Creative Economy State Profiles, and don’t hesitate to contact me for help using this information in your state.