

November 8, 2013
Visualizing Support for the Arts
State arts agencies continuously collect data describing their grant-making activities. These data can tell a powerful story about the public value of state investment in the arts.
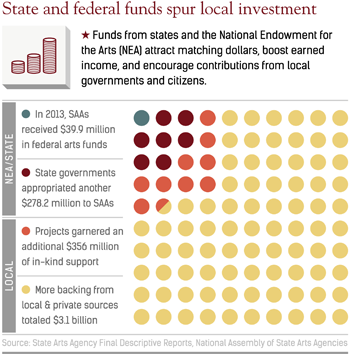
For example, we know from the national data set taken from state arts agency Final Descriptive Reports that the relatively small investments made by state and federal governments in fiscal year 2013 catalyzed more than $3.1 billion in total project support.
Communicating data effectively often means visualizing data in compelling ways. The graphic below is based on simple information available to every state arts agency: federal, state and matching funds. While this data could be presented in a plain table, using illustration techniques adds visual appeal, enhances the impact of the information and drives home a “return on investment” message.
Need help deciphering and visualizing your data to make the arguments that you need? NASAA research staff can help you navigate the necessary data points and comparisons to find the right way to communicate your data effectively. To find out more, contact NASAA Research Director Ryan Stubbs.