
Updated Creative Economy State Profiles are now available, describing the value of arts and cultural production to the U.S. and state economies. Data in the profiles come from the Arts and Cultural Production Satellite Account (ACPSA), published by the the U.S. Bureau of Economic Analysis (BEA) in partnership with the National Endowment for the Arts. They are an authoritative source for the value of the creative economy in every state.
COVID-19 is affecting all aspects of the global economy. It is clear that creative industries will be especially affected by this crisis, given how uniquely integral to our sector are public gatherings, school based work and travel. This is not just an economic story, it’s a social story, too—because the arts and culture strengthen our ties by facilitating community and interpersonal engagement.
| In the United States, arts and cultural production contributes a higher dollar amount to the U.S. economy than construction and transportation |
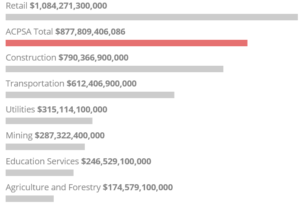 |
This slowdown in the creative economy will have a significant impact on the American economy. These data give policymakers solid information about what’s at stake for the arts and for related economic sectors that rely on creative inputs. Arts and cultural production accounts for $877.8 billion in value and 4.5% of U.S. gross domestic product. When looking at the nation as a whole, this value is above both the construction industry and the transportation industry. In the coming months, sustaining businesses, organizations and artists that make up this economic powerhouse will be crucial to our nation’s recovery.
NASAA’s Creative Economy State Profiles make data from the ACPSA more accessible and engaging. Our interactive dashboard, produced in cooperation with the Arts Endowment, explores visual information describing the creative economy in every state. The tool gives you instant access to highly credible data that are especially useful for making the case that the arts contribute substantially to your state’s economy.
Your state’s creative economy story is unique, and this tool allows you to explore and share that story with key decision makers. Use the Creative Economy State Profiles to understand:
This year, we’ve made two improvements to this resource. First, while not part of the ACPSA data, we’ve visualized relevant creative economy data for five U.S. territories using data from the Census Bureau and the World Bank. Please see Creative Economy in the U.S. Territories. Second, we’ve enhanced the ability to print the dashboards; please try the Print button in the upper right-hand corner of the dashboard.
Designed to complement the Arts Endowment’s growing suite of ACPSA resources, this interactive dashboard is one of many tools available to state arts agencies and arts advocates to understand and communicate accurate data about your creative economy.
Please view and explore the Creative Economy State Profiles, and don’t hesitate to contact me for help using this information in your state.
Ryan Stubbs
Senior Director of Research